Administrator’s guide#
HA deployment#
To enhance high availability and minimize system downtime, deploy the Acura High Availability (HA) solution.
Acura HA ensures consistent operation for applications and services, which is especially critical for mission-critical systems. The multiple nodes eliminate failure points and ensure continuous system operation even in the case of hardware or software failures. Connected nodes prevent data loss during failures and allow for quick recovery of the system state. The load balancer (LB) effectively distributes traffic between nodes, eliminating overloads and ensuring stable performance even under peak loads. Troubleshooting nodes is performed without the need to stop the system, making this solution a reliable foundation for business processes.
HA systems are an important infrastructure element that maintains stable business operations and minimizes the risks associated with failures.
To deploy HA, you only need:
- three virtual machines running Ubuntu 24.04
- one virtual machine for load balancing.
Increase the number of nodes if necessary, adapting the system to the needs of your organization.
Preconditions#
To deploy an Acura HA cluster, you need a deploy VM with Python 3.11. You can use Ubuntu 24.04,
or if you use a later release, you can install pyenv to set up Python 3.11.
Instructions can be found here.
Deployment steps#
Step 1. Prepare Security Group#
Please review the following ingress rules before deployment:
| Ether Type | IP Protocol | Port Range | Remote IP Prefix | Remote Security Group | Description |
|---|---|---|---|---|---|
| IPv4 | TCP | 1 - 65535 | - | Acura_ha | Please note that we need to open all TCP ports for the security group we created. This is required for Kubernetes connectivity between nodes (e.g., for etcd or MariaDB clusters). |
| IPv4 | TCP | 22 (SSH) | <IP*>/32 | - | Allow TCP port 22 from my public IP for SSH and Ansible. |
| IPv4 | TCP | 80 (HTTP) | - | - | The Acura UI port redirects the user to the HTTPS port. |
| IPv4 | TCP | 443 (HTTPS) | 0.0.0.0/0 | - | Acura UI port |
| IPv4 | TCP | 4443 | 0.0.0.0/0 | - | Initial Configuration Port |
| IPv4 | TCP | 6443 | 0.0.0.0/0 | - | Port for the Kubernetes API service |
| IPv4 | UDP | 12201 | 0.0.0.0/0 | - | Logs port: Used by agents and pods to send logs to the ELK stack. |
IP* - the IP address you want to use to access the Acura.
Note
The deploy VM should have access to port 22 for all three VMs and the load balancer (LB). In the security group (SG) above, only one public IP is allowed for port 22. Ensure your deploy VM uses this public IP, or add another rule to the SG.
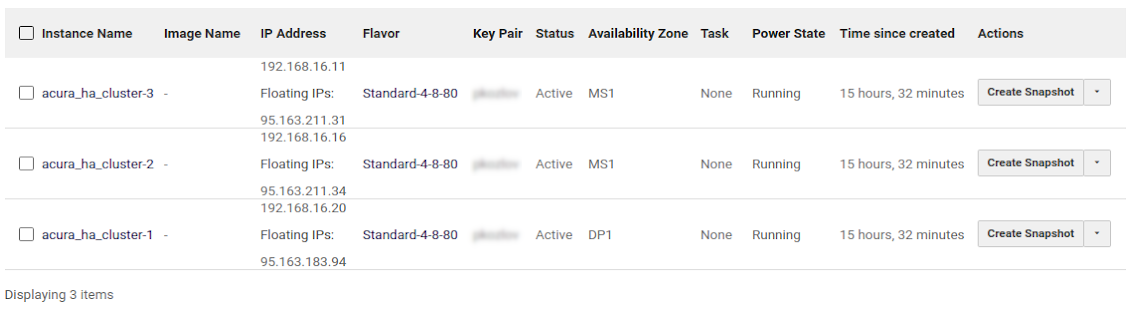
Step 2. Create three Ubuntu VMs#
Create three Ubuntu 24.04 instances with 200 GB volumes (SSD backend recommended). The entire 200 GB should be available as a single partition, without separate partitions for /home, etc. It is also recommended to allocate at least 16 GB of RAM and 8 vCPUs for each instance.
Example:
Verify that the DNS servers on all nodes (cat /etc/resolv.conf) are correct. They should be obtained from the DHCP server.
For example, the result of the nslookup command should resemble the following:
$ nslookup google.com
Server:     8.8.8.8
Address:    8.8.8.8#53

Non-authoritative answer:cd
Name:   google.com
Address: 64.233.165.113
Name:   google.com
...
If the DNS servers don’t work, check the DNS configuration of the subnet (e.g., use 8.8.8.8 as the DNS server). Hostnames should not be fully qualified domain names (FQDNs); they should not contain dots.

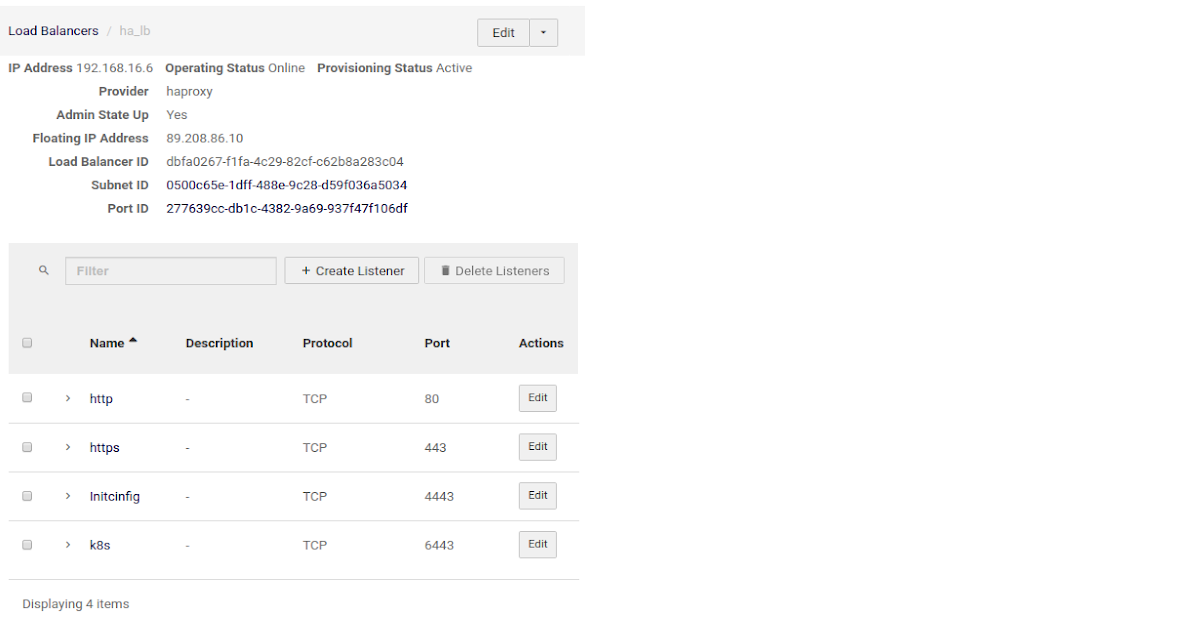
Step 3. Create a Load Balancer#
Use the following listeners:
| Name | Description | Protocol | Port |
|---|---|---|---|
| initconfig | Initial Configuration UI Listener | TCP | 4443 |
| http | HTTP Listener | TCP | 80 |
| k8s | Kubernetes API Service Listener | TCP | 6443 |
| https | HTTPS Listener for Acura UI | TCP | 443 |
Example of Cloud-Native LB Configuration
NGINX Configuration
Don’t forget to replace X.X.X.X, Y.Y.Y.Y, and Z.Z.Z.Z with the IP addresses of your nodes. Use the IP address of the first node for X.X.X.X, the second node for Y.Y.Y.Y, and the third node for Z.Z.Z.Z.
$ cat /etc/nginx/nginx.conf
user www-data;
worker_processes auto;
worker_rlimit_nofile 70000;
pid /run/nginx.pid;

events {
        worker_connections 70000;
    # multi_accept on;
}

stream {
    upstream stream_http {
        least_conn;
        server X.X.X.X:80;
        server Y.Y.Y.Y:80;
        server Z.Z.Z.Z:80;
    }

    upstream stream_https {
        least_conn;
        server X.X.X.X:443;
        server Y.Y.Y.Y:443;
        server Z.Z.Z.Z:443;
    }

    upstream stream_initial_config {
        least_conn;
        server X.X.X.X:4443;
        server Y.Y.Y.Y:4443;
        server Z.Z.Z.Z:4443;
    }

    upstream stream_kubernetes {
        least_conn;
        server X.X.X.X:6443;
        server Y.Y.Y.Y:6443;
        server Z.Z.Z.Z:6443;
    }

    upstream stream_elk {
        least_conn;
        server X.X.X.X:12201;
        server Y.Y.Y.Y:12201;
        server Z.Z.Z.Z:12201;
    }

    upstream stream_registry {
        least_conn;
        server X.X.X.X:15000;
        server Y.Y.Y.Y:15000;
        server Z.Z.Z.Z:15000;
    }

    server {
        listen        80;
        proxy_pass    stream_http;
    }

    server {
        listen        443;
        proxy_pass    stream_https;
        proxy_buffer_size 10m;
    }

    server {
        listen        4443;
        proxy_pass    stream_initial_config;
    }

    server {
        listen        6443;
        proxy_pass    stream_kubernetes;
        proxy_timeout 10s;
        proxy_connect_timeout 10s;
    }

    server {
        listen     12201 udp;
        proxy_pass stream_elk;
        proxy_timeout 30s;
        proxy_connect_timeout 60s;
    }

    server {
        listen        15000;
        proxy_pass    stream_registry;
    }
}
Troubleshooting
-
If you encounter issues starting or restarting NGINX after changing the configuration, you can verify the correctness of the config using the following command:
nginx -t -
If you receive an error such as the unknown directive 'stream' when starting NGINX, add the following line to the beginning of the configuration:
load_module /usr/lib/nginx/modules/ngx_stream_module.so;
Check SSH access from the deploy VM to the Acura VMs
To save time, check access to port 22 before running any installations. You can verify the access with the following simple Bash command:
$ for i in X.X.X.X Y.Y.Y.Y Z.Z.Z.Z; do nc -vz -w 2 $i 22 ; done
Connection to X.X.X.X 22 port [tcp/ssh] succeeded!
Connection to Y.Y.Y.Y 22 port [tcp/ssh] succeeded!
Connection to Z.Z.Z.Z 22 port [tcp/ssh] succeeded!
Where X.X.X.X, Y.Y.Y.Y, and Z.Z.Z.Z are the target public IPs to check access. If access is unavailable, you will see output similar to this:
$ for i in X.X.X.X Y.Y.Y.Y Z.Z.Z.Z; do nc -vz -w 2 $i 22 ; done
nc: connect to X.X.X.X port 22 (TCP) timed out: Operation now in progress
nc: connect to Y.Y.Y.Y port 22 (TCP) timed out: Operation now in progress
nc: connect to Z.Z.Z.Z port 22 (TCP) timed out: Operation now in progress
In that case, check your security group settings.
Step 4. Prepare the environment on the localhost#
1. Install required packages
sudo apt install python3-pip sshpass
pip3 install --upgrade pip==20.3.4
pip3 install "virtualenv<20.0"
2. Download Hystax archive from the provided URL
3. Extract archive “hystax-ha-archive.tar.gz”
tar xvzf hystax-ha-archive.tar.gz
4. Install requirements
cd hystax_ha_archive
source venv.sh
pip install -r requirements.txt
If installation fails, try installing this Ubuntu package: sudo apt install libffi-dev.
And then run pip install -r requirements.txt again.
5. Create “ha_env_file” HA environment file with the following content
<HOSTNAME1> ansible_ssh_host=<X.X.X.X>
<HOSTNAME2> ansible_ssh_host=<Y.Y.Y.Y>
<HOSTNAME3> ansible_ssh_host=<Z.Z.Z.Z>
Note
HOSTNAME1 is the hostname of the first Ubuntu machine, X.X.X.X is the public IP address of the first Ubuntu machine, and so on.
Troubleshooting
If the Acura hosts use separate SSH keys (not ~/.ssh/id_rsa), you can specify the key in the ha_env_file as follows:
ansible_ssh_private_key_file=<path_to_your_private_key>
If you're using password-protected SSH keys, add them to the SSH agent with the following commands:
1. Start the SSH agent in the background:
$ eval "$(ssh-agent -s)"
2. Add the SSH private key to the SSH agent:
$ ssh-add ~/.ssh/id_rsa"
Step 5. Install Kubernetes master#
Deploy Kubernetes HA Master:
export ANSIBLE_HOST_KEY_CHECKING=False
ansible-playbook -e "ansible_ssh_user=<SSH_USER_NAME>" \
-e "lb_address=<LOAD_BALANCER_IP>" \
-e "ansible_python_interpreter=/usr/bin/python3" \
-e "logstash_host=127.0.0.1" \
-i ha_env_file ansible/k8s-master.yaml
Troubleshooting
If, when executing the command, you are prompted for a password, and you want
to use SSH keys from the instances created in the step 2, you can specify the SSH
private key in the ha_env_file (step 4) as follows:
ansible_ssh_private_key_file=<path_to_your_private_key>
This will avoid issues with entering passwords manually.
If the user does not have root privileges, add the -K flag to the command
to prompt for the password immediately when the playbook starts.
Step 6. Deploy Acura#
Use the following command to deploy the Acura HA cluster:
export ANSIBLE_HOST_KEY_CHECKING=False
ansible-playbook -e "ansible_ssh_user=<SSH USER NAME>" \
-e '{"overlay_list": ["overlay/ha.yaml", "overlay/golden-image.yml", "overlay/distr-dr.yaml", "overlay/startup_reconfigure.yaml"]}' \
-e "copy_patch=true" \
-e "copy_ca=true" \
-i ha_env_file ansible/ha-acura.yaml
Note
This command deploys Acura Disaster Recovery. If you want to deploy Acura Migration, replace distr-dr.yaml with distr-migration.yaml.
Post-Deployment
1. Check that all Acura Kubernetes pods have started.
2. To configure Acura, go to the initial-config UI at:
https://<LOAD-BALANCER-PUBLIC-IP>
Example: https://89.208.86.10.
How-tos#
Update an already deployed Acura#
1. Perform Step 4. Prepare the environment on the localhost. Get a list of existing overlays used when creating the cluster:
kubectl exec -ti etcd-0 -- etcdctl get /overlay_list
If necessary, change the list of overlays in etcd:
kubectl exec -ti etcd-0 -- etcdctl set /overlay_list ["old_overlay1","old_overlay2",<...>,"new_overlay"]
2. Perform Step 6. Deploy Acura. When deploying Acura, add the new parameter to the
ansible-playbook command: -e "update_cluster=true". For example:
export ANSIBLE_HOST_KEY_CHECKING=False
ansible-playbook -e "ansible_ssh_user=<SSH_USER_NAME>" \
-e '{"overlay_list": ["overlay/ha.yaml", "overlay/golden-image.yml", "overlay/distr-dr.yaml", "overlay/startup_reconfigure.yaml", "overlay/big-heat-stack-timeout.yaml"]}' \
-e "copy_patch=true" \
-e "copy_ca=true" \
-e "update_cluster=true" \
-i ha_env_file ansible/ha-acura.yaml
Remove a dead node from Acura HA#
1. Log into a Live Node.
2. Run the following command to identify the dead node names:
kubectl get nodes
3. Run kubectl delete node <DEAD_NODE_NAME> to remove the dead node from Kubernetes.
Replace
4. Run
kubectl exec etcd-<LIVE_NODE_NAME> -n kube-system -- etcdctl --cacert /etc/kubernetes/pki/etcd/ca.crt --cert /etc/kubernetes/pki/etcd/peer.crt --key /etc/kubernetes/pki/etcd/peer.key member list
to identify a dead node etcd member ID (first column in output).
Replace
5. Run
kubectl exec etcd-<LIVE_NODE_NAME> -n kube-system -- etcdctl --cacert /etc/kubernetes/pki/etcd/ca.crt --cert /etc/kubernetes/pki/etcd/peer.crt --key /etc/kubernetes/pki/etcd/peer.key member remove <DEAD_MEMBER_ID>
to remove the dead node from the etcd cluster.
Replace
Add a new node#
1. Follow the steps in the previous section to remove any dead nodes from the cluster.
2. Perform deployment steps 2-3 for a new Ubuntu machine:
3. Log into a live node and run the following commands:
-
Create the join token:
kubeadm token create --print-join-commandThis command will output
master_tokenandmaster_discovery_token. Copy and store them securely. -
Upload the certificates:
sudo kubeadm init phase upload-certs --upload-certsThis command will output
master_cert_key. Copy and store it securely.
4. Perform deployment Step 4. Prepare the environment on the localhost.
5. Use the tokens and certificate key generated earlier to add the new node to the cluster:
source venv.sh
pip install -r requirements.txt
patch_url='<link-to-patch>'
ca_url='<link-to-ca-image>'
export ANSIBLE_HOST_KEY_CHECKING=False
ansible-playbook -e "ansible_ssh_user=<SSH_USER_NAME>" \
-e "ansible_python_interpreter=/usr/bin/python3" \
-e "lb_address=<LOAD_BALANCER_IP>" \
-e "logstash_host=127.0.0.1" \
-e "master_token=ae9wn..." \
-e "master_discovery_token=bf917..." \
-e "master_cert_key=4cc2c..." \
-e "copy_patch=true" \
-e "copy_ca=true" \
-i "<NEWLY_PROVISIONED_INSTANCE_IP>," \
ansible/k8s-add-node.yaml
Notes:
- Set
lb_addressto your load balancer's address. - Set
master_token,master_discovery_token, andmaster_cert_keyto the tokens you obtained previously. Refer to the example to confirm their correct format. - Set the address after
-ito the IP address of your newly provisioned instance.
Backup internal Acura DBs#
Overview#
Sometimes issues can occur with the machine hosting the Acura deployment. The problem can be solved by backups of etcd, Maria and Mongo databases, with the option to restore them on an external virtual machine. Backups must be performed regularly, which is why the process is automated using a cron job. It can be divided into two stages: creating backups and uploading the archive to external storage.
etcd and DBs Backup#
Cron job parameters are defined through the overlay. Below is an example with default values:
external_backup:
  suspend: false
  mountpoint: /acura/backup
  schedule: "@daily"
  keep: 5
  name: &external_backup_name
  startingDeadlineSeconds: 100
  image:
    repository: *external_backup_name
    tag: local
- mountpoint – local backup storage path on the Acura machine
- keep – maximum number of backups to retain
- name – name of the external backup archive
The backup saves all etcd keys to acura_etcd-<timestamp>.dump. It also runs shell scripts to export MariaDB to acura_db_<timestamp>.sql.gz and the MongoDB events collection to acura_mongo_<timestamp>.json.gz. Only the last n files are retained (see the keep parameter).
Find all three files archived in the acura_etcd-<timestamp>.tar.gz file.
External Backup#
The external backup copies the Acura DBs backup stored locally to the remove VM.
The external backup parameters are configured in etcd. If they are not specified, backups are assumed to be stored locally only. Example:
external_backup:
  type: object-storage
  key: username
  secret: password
  url: http://172.22.5.88:9000
  bucket: some-bucket
  region: some-region (optional)
  backup_path: some/path/folder (optional)
- type – expected values:
object-storageorlocal - url – URL of the object storage
- bucket – name of the bucket to store backups
- region – storage region (optional parameter)
- backup_path – path where the external backup archive will be stored (optional parameter)
If any parameter is missing (except for the region and backup_path), the external backup process fails. However, it's important to note that in case of any error, the individual local backups still remain on the machine.
The backup archives the latest backups from the etcd and dbs backup stage into a file named acura_backup_<timestamp>.tar.gz. If the appropriate parameters are set, the archive is uploaded to object storage (see the backup_path parameter). If no storage parameters are specified, the backups remain stored locally.
Recovery Process#
After the local backups of the Acura databases are uploaded to the remote VM, restore them using the alias: hx_restore_from_backup.
Port Security & Aliases#
Network ports and services#
Acura controllers are hardened to reduce the attack surface and simplify access management. Find services on ports:
-
SSH -
tcp/22 -
HTTP (redirects to 443 if enabled) -
tcp/80 -
HTTPS -
tcp/443 -
Initial Configuration (closes automatically after setup) -
tcp/4443 -
GELF logging -
tcp+udp/12201 -
Internal Docker registry (agent auto-update, external replication agent for oVirt/OpenStack docker-compose mode) -
tcp/15000
Web tools access#
phpMyAdmin, Metrics Dashboard, and Logs can be find at:
-
phpMyAdmin (disabled by default) →
https://<ACURA_IP_ADDRESS>/tools/db -
Metrics Dashboard (Grafana) →
https://<ACURA_IP_ADDRESS>/tools/metrics(clarify the login and password with our Support team) -
Logs →
https://<ACURA_IP_ADDRESS>/tools/logs(clarify the login and password with our Support team)
Managing features via scripts#
To balance security and usability, convenient aliases (hx_* scripts) are provided for enabling or disabling features such as phpMyAdmin, SSL, and others.
These scripts apply changes immediately, without requiring a pod restart.
To use them:
-
Access the Acura box, enter the string:
ssh user@<ACURA_IP_ADDRESS>Replace
<ACURA_IP_ADDRESS>with the device’s real IP or hostname. When prompted, enter the password. Please clarify the password with our Support team. -
Run the desired
hx_*script:-
Show Acura version:
hx_cluster_info -
Enable engineer user (for specific boxes where it’s disabled by default, e.g. AWS):
hx_enable_engineer -
Restore Acura databases from a backup file (about Backup internal Acura DBs):
hx_restore_from_backup -
Enable or disable phpMyAdmin access:
-
enable for 12 hours:
hx_enable_phpmyadmin -
disable:
hx_disable_phpmyadmin
-
-
Enable or disable SSL redirection (HTTP → HTTPS):
-
enable:
hx_enable_ssl_redirect -
disable:
hx_disable_ssl_redirect
-
-
Grafana#
Grafana is a powerful visualization and monitoring tool that helps to understand system performance at a glance. In the Acura environment, it provides ready-made dashboards with real-time metrics on replication, network usage, and resource bottlenecks. By using these dashboards, administrators can quickly identify issues, optimize system performance, and track the health of replication processes.
How to interpret data using Grafana#
To access the Grafana dashboards log in at https://<ACURA_IP_ADDRESS>/tools/metrics.
Please clarify the login and password with our Support team.
On the Home Dashboard page find:
- the list of useful dashboards
- global replication speed and network utilization.
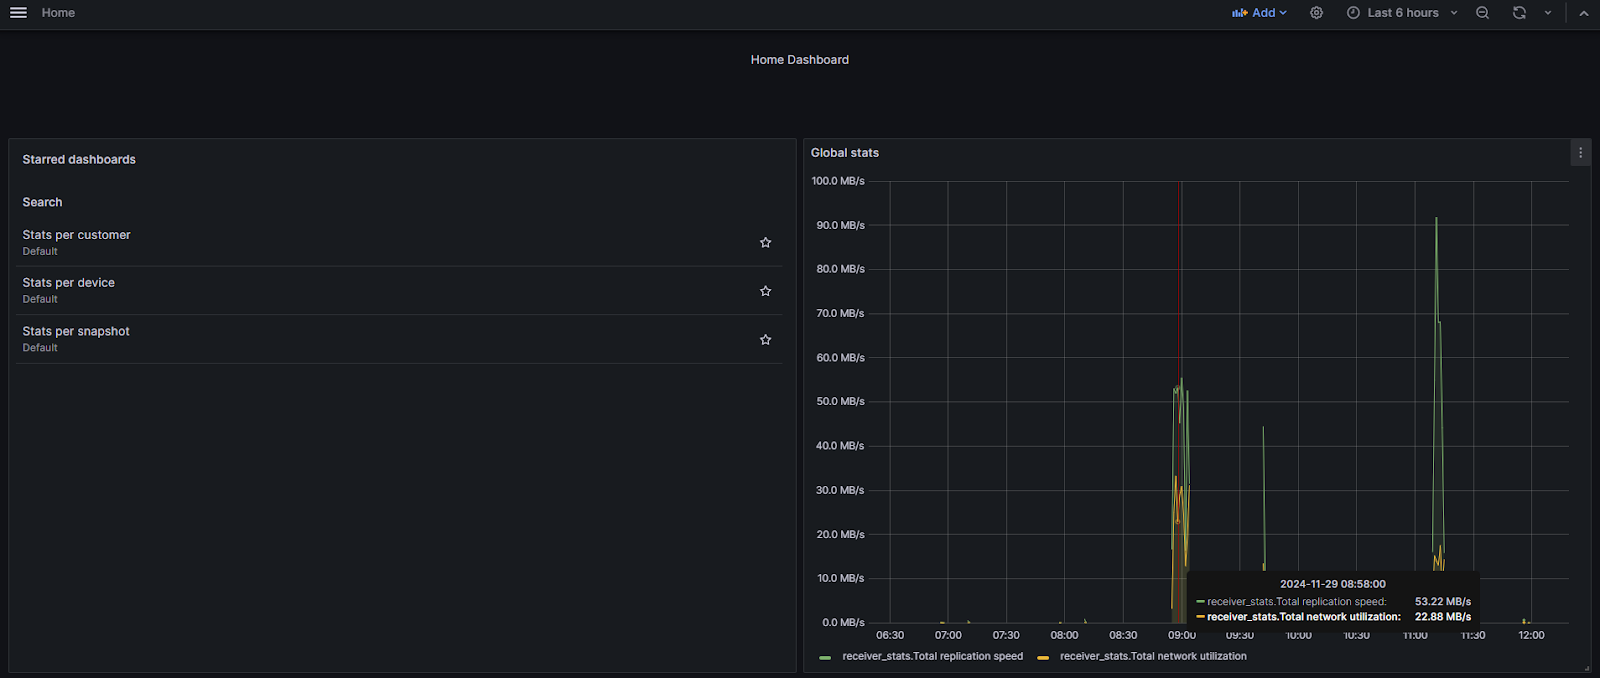
We’ve starred 3 dashboards for your usability. Find them on the left panel of the Home Dashboard: the stats for customers, devices, and snapshots. They include a set of panels:
-
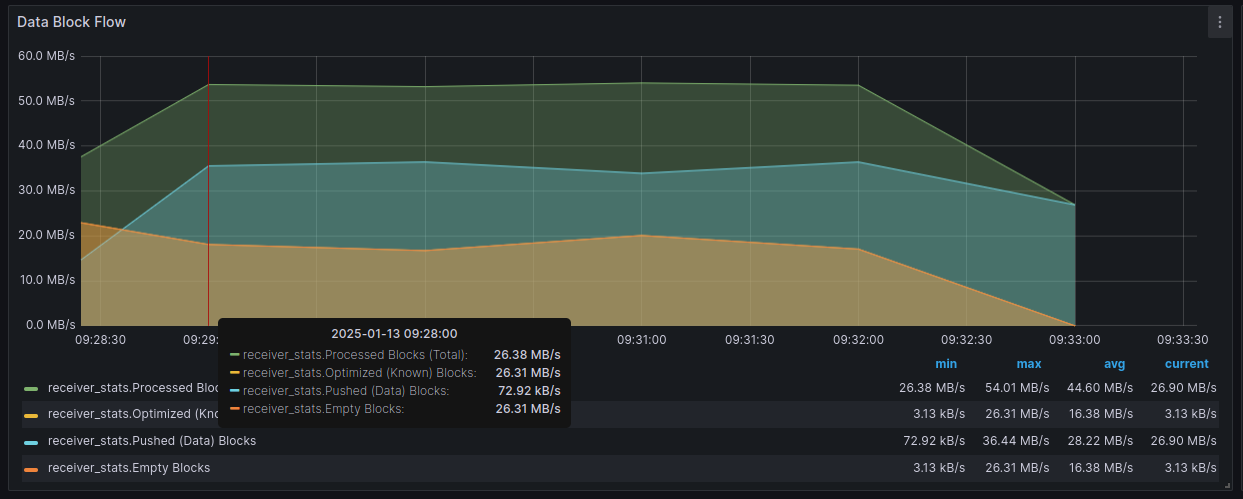
Data Block Flow measures replication speed, with a breakdown of block types
-
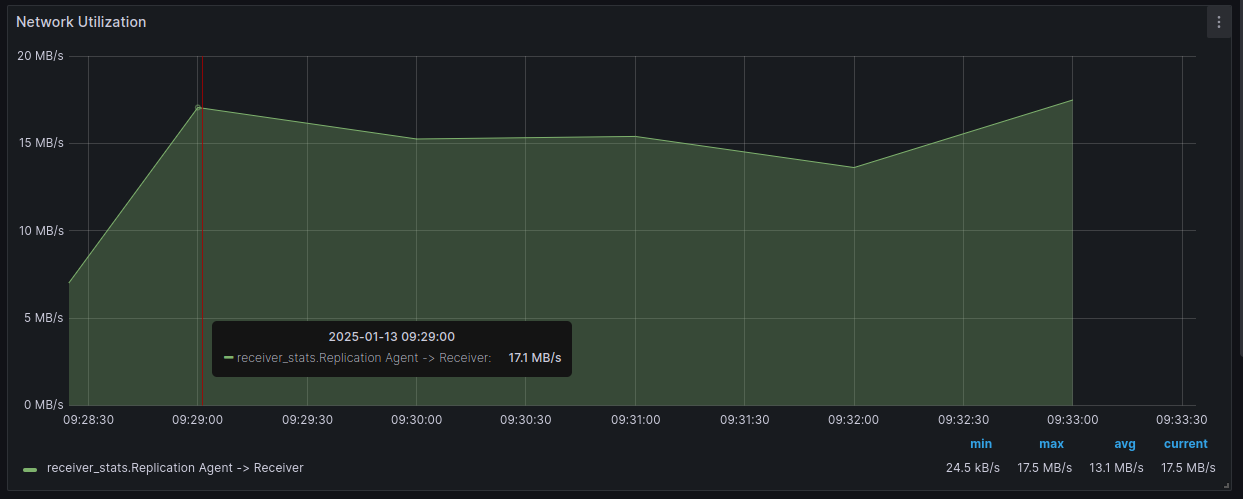
Network Utilization measures real network traffic (currently only between Replication Agent and Acura, without Cloud Agent traffic)
-
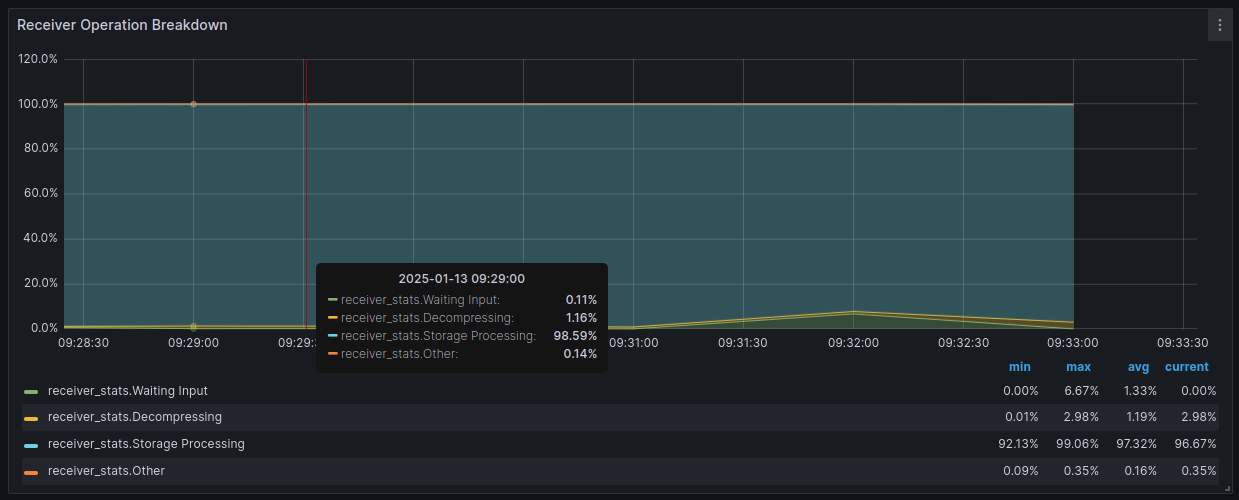
Receiver Operation Breakdown measures the percent of time the Receiver spent doing its operations. This is useful for finding bottlenecks:
- If the Receiver spends most of the time waiting for input, it means the Replication Agent can’t read or send fast enough.
- If the Receiver spent most of the time on storage processing, it means the Cloud Agent can’t receive or write fast enough.
-
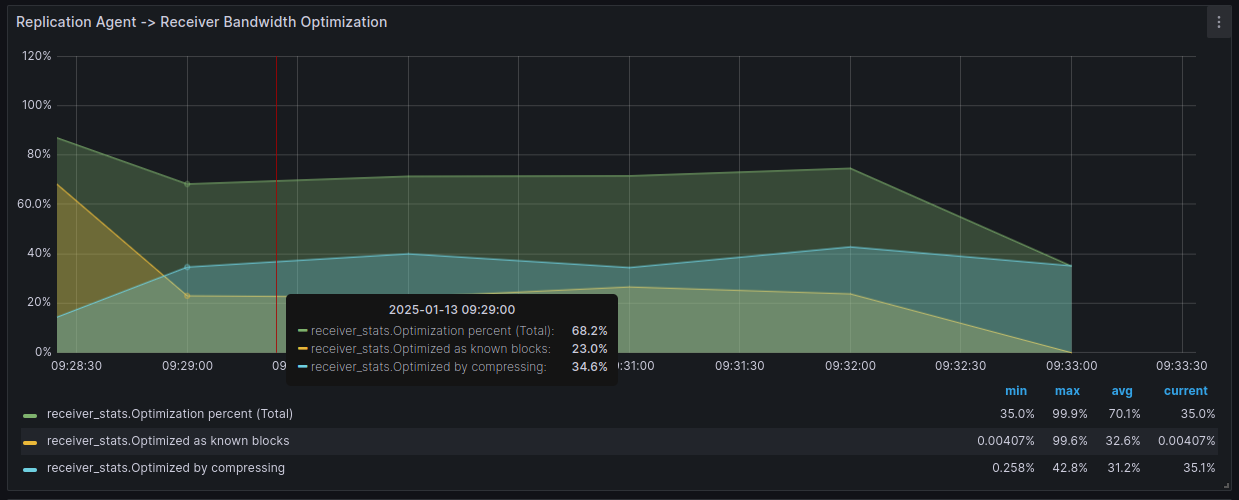
Replication agent → Receiver Bandwidth optimization metric measures how much network traffic was saved through compression and WAN optimization
-
Processing speed measures the speed of individual Receiver and Replication Agent operations
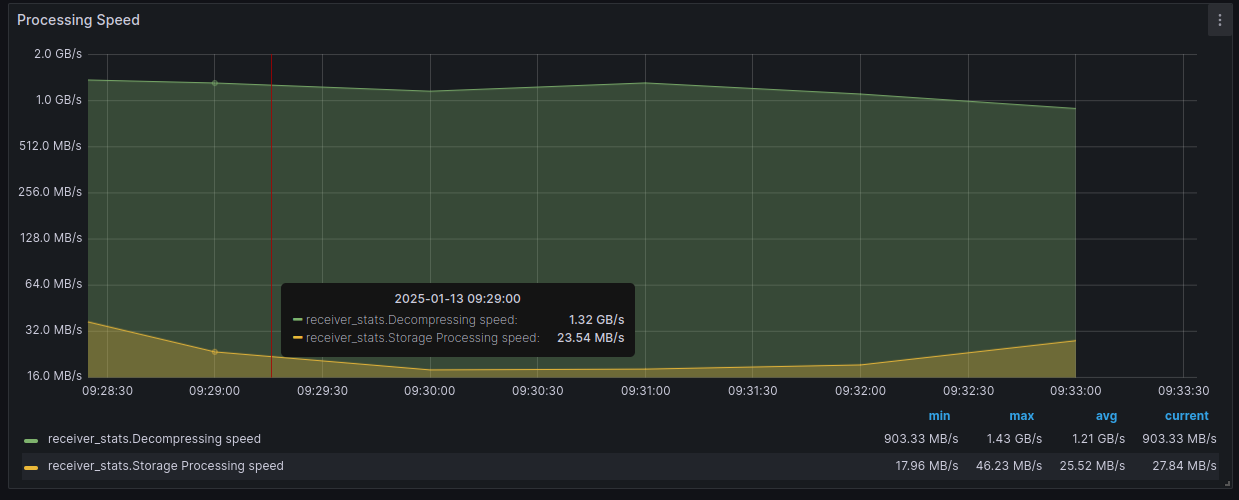
-
Receiver threads measure how many threads in the Receiver are active
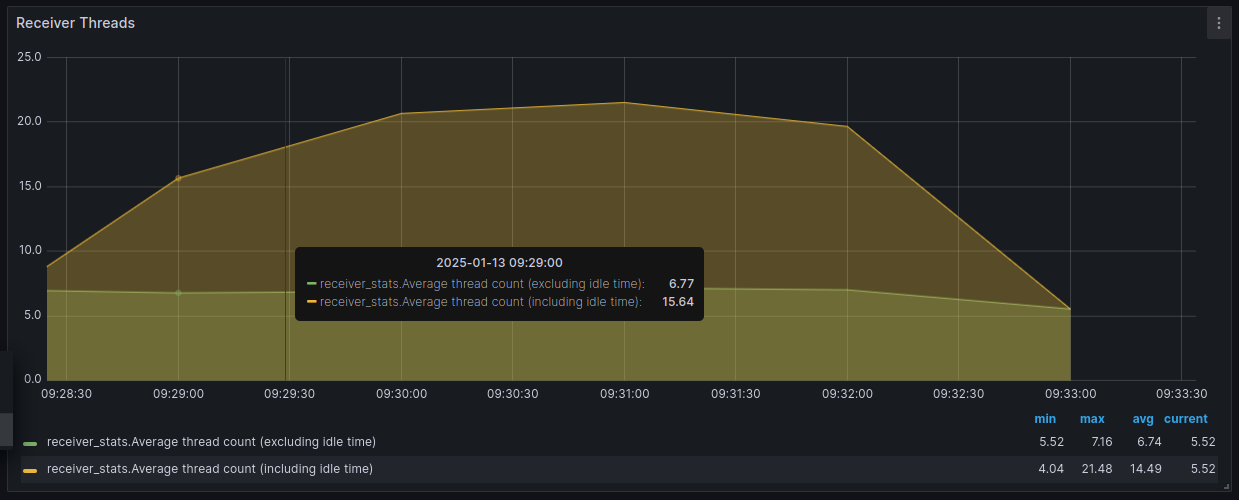
Get the tooltip by hovering on the chart.
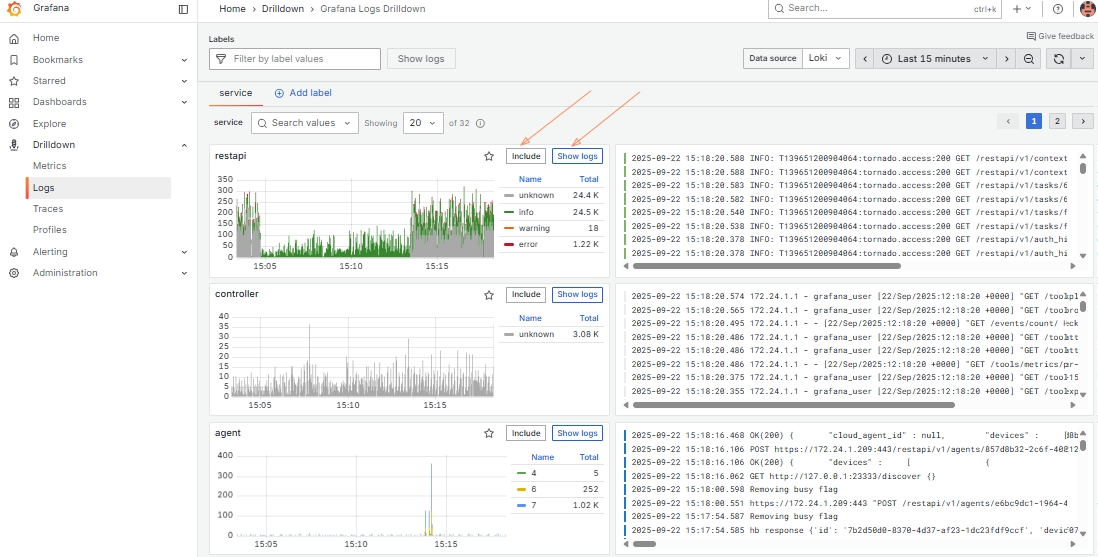
How to view logs#
There are two ways how to access logs. Please clarify the login and password with our Support team.
1. Go to https://<ACURA_IP_ADDRESS>/tools/logs.
2. Go to https://<ACURA_IP_ADDRESS>/tools/metrics. Navigate to Drilldown -> Logs.
On the service tab of the main page, find logs grouped by service_name. Use this view to observe the general situation on the Acura cluster.
For detailed information about a specific service, use the Labels field to set filters according to your needs.
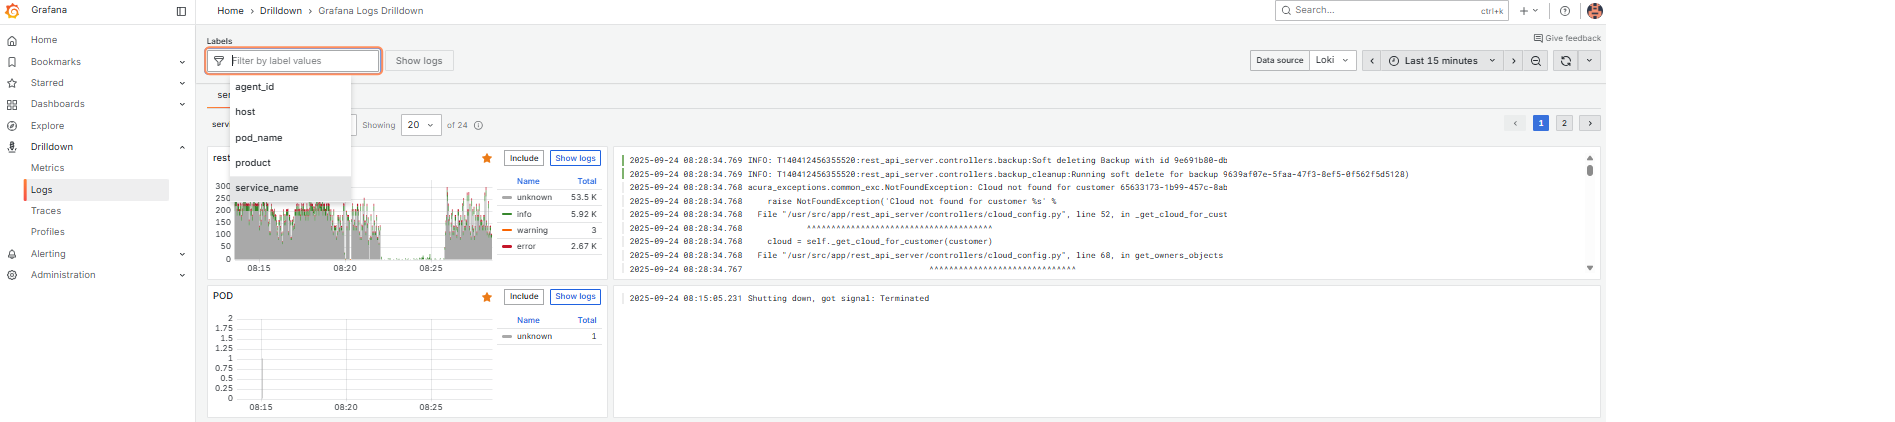
Use Log levels, Fields to filter data more properly.
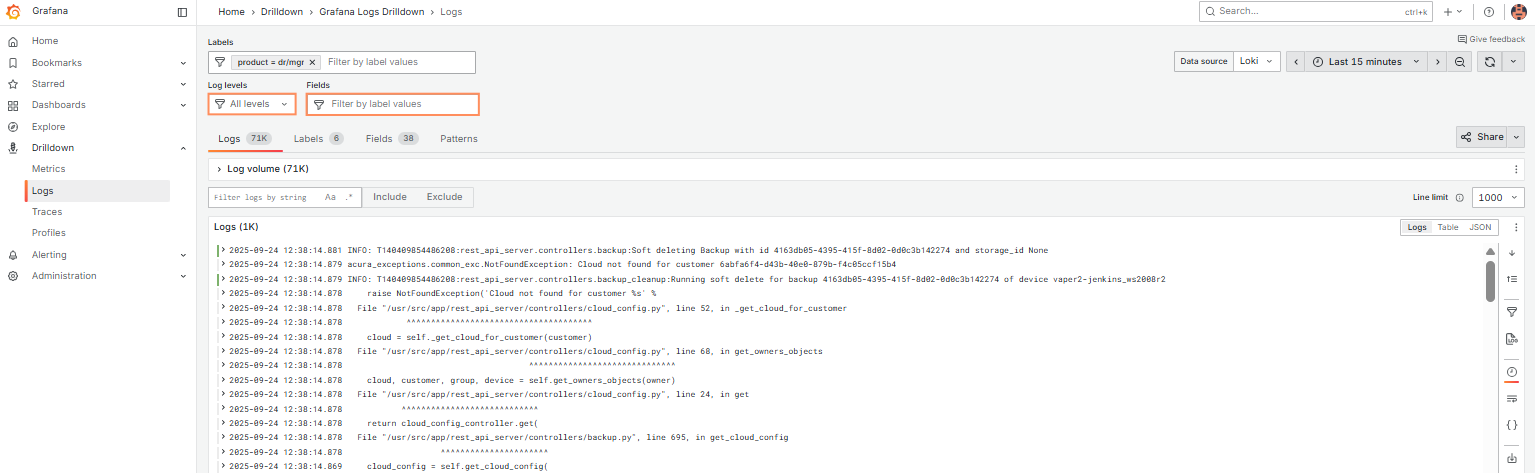
Expand any log line to see all available metadata and access quick filter controls. Explore the different tabs to get complete information.
Tips:
1. Use time and refresh controls in the upper right corner to set log interval and auto-refresh.
2. Use “Labels” input to filter by labels (service_name, agent_id, etc). Remove all labels to return back to log overview.
3. Use “Fields” input to filter by structured metadata (all fields that aren’t labels: customer_id, image_name, etc).
4. Use “Search in log lines” for search. Spaces and special characters are fine – unlike Kibana, Grafana runs a simple substring search, similar to grep.
-
If you want to search with AND condition (apple AND banana), type apple, hit enter, then type banana and hit enter again – you’ll add two line filters.
-
If you want to search with OR condition (apple OR banana), use .* button to enable regex search and then write the usual regex syntax: apple|banana.
5. The right bar near log lines is very useful: you can hide/show timestamps, automatically expand multi-line logs and download displayed log lines.
6. If you want to see all Acura logs in one place, you can use the catch-all product label, which is always dr/mgr.
7. Group by labels you need by pressing “Add label” (on the right of the service tab).
8. To add a filter:
-
Click Include to add multiple label values.
-
Click Show logs to display logs for the selected labels.