Page overview#
The Resources page provides a centralized, detailed view of all resources across connected data sources. Observe the expenses for all resources within the organization for the selected period. Organize and categorize resources based on your specific requirements.
Go get to the page find Resources in the menu.
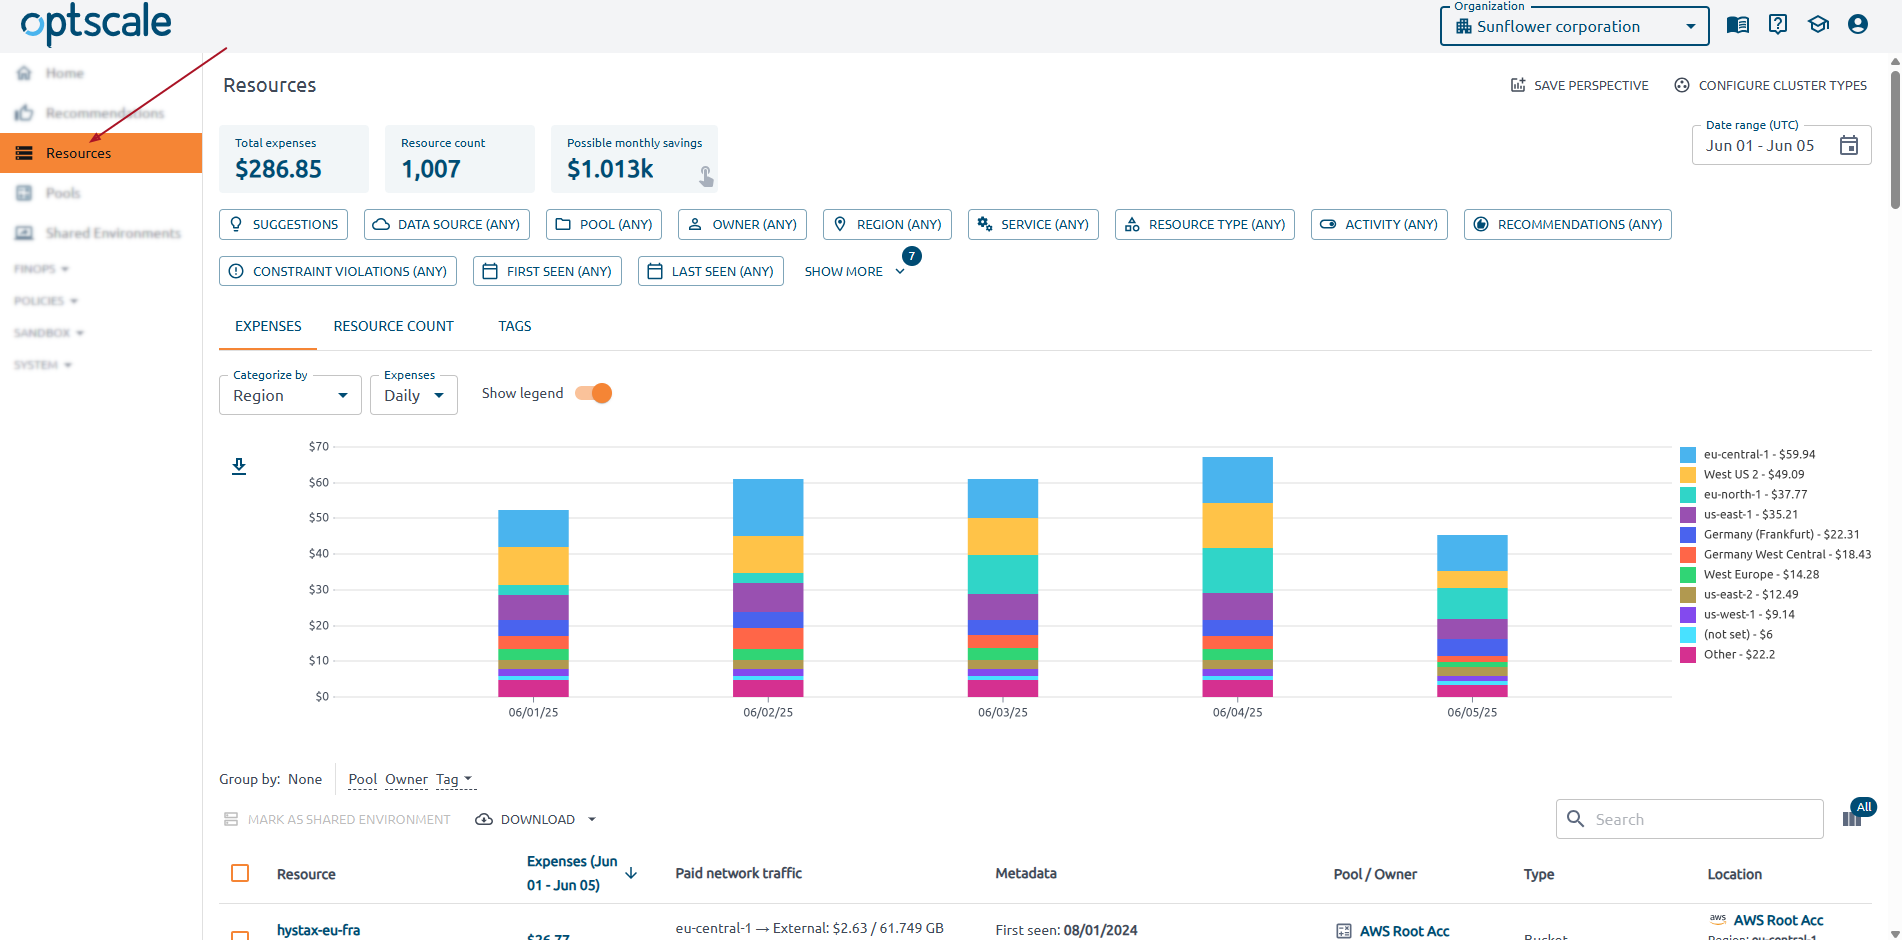
Find Total expenses, Resource count and Possible monthly savings in the summary cards at the top of the page. The Possible monthly savings card is clickable — use it to view recommendations.
A wide variety of filters below allows to filter the data effectively. More than 10 entities are available for data filtering. Use the Date range field, either together with filters or separately, to set a time range. The SAVE PERSPECTIVE button saves your personalized view with applied filters. Click CONFIGURE CLUSTER TYPES to add, update the priority, delete, and re-apply cluster types.
Tabs#
The Resources page is organized into three powerful tabs: Expenses, Resource Count, and Tags. Each tab offers a different perspective for analyzing cloud usage and cost.
Expenses#
By default, the chart displays data categorized by service and daily expenses. These settings can be customized. You can also use the EXPORT CHART button to save the chart as a PNG file. Hover over the chart to see detailed information.
The table is sorted by expenses. Additionally, group it by pool, owner, or tag. To analyze and manage your data offline, DOWNLOAD the list of resources in JSON or XLSX format.
The rows in the table are clickable — click on a resource to view detailed information. Pay attention to the icons below each resource, which indicate its state, any policy violations, and whether a schedule is set for it.
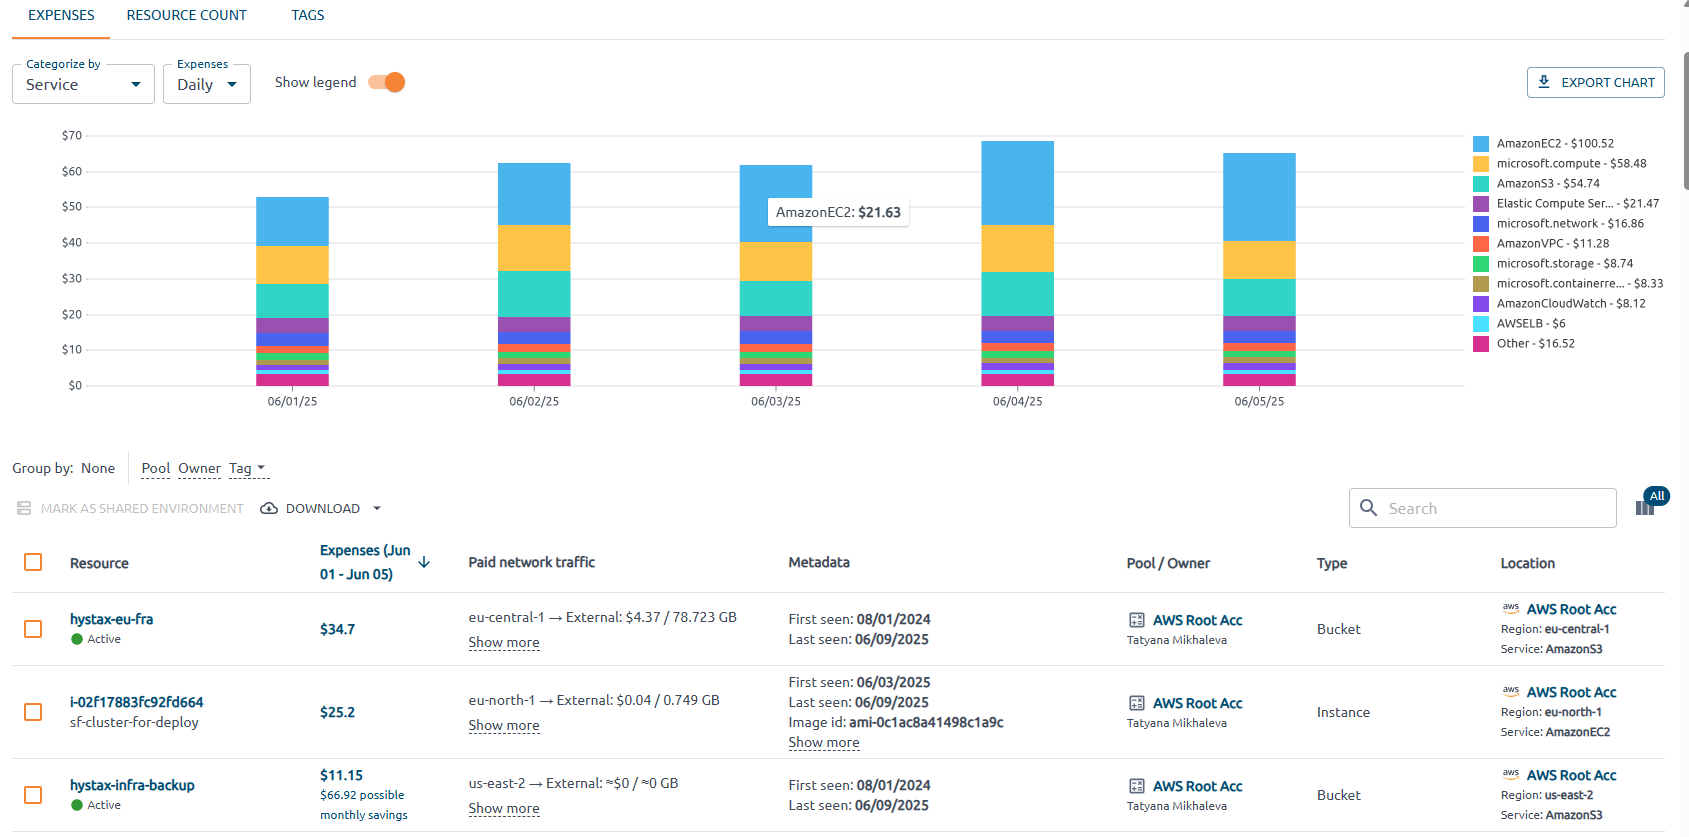
Mark the resources by selecting the checkboxes in the first column, then click the MARK AS SHARED ENVIRONMENT button to share the selected resources. Learn more about shared environments.
Resource count#
By default, the chart and table display data categorized by service. Change a category based on your needs. Hide weekends and legend if necessary. Hover over the chart to see detailed information.
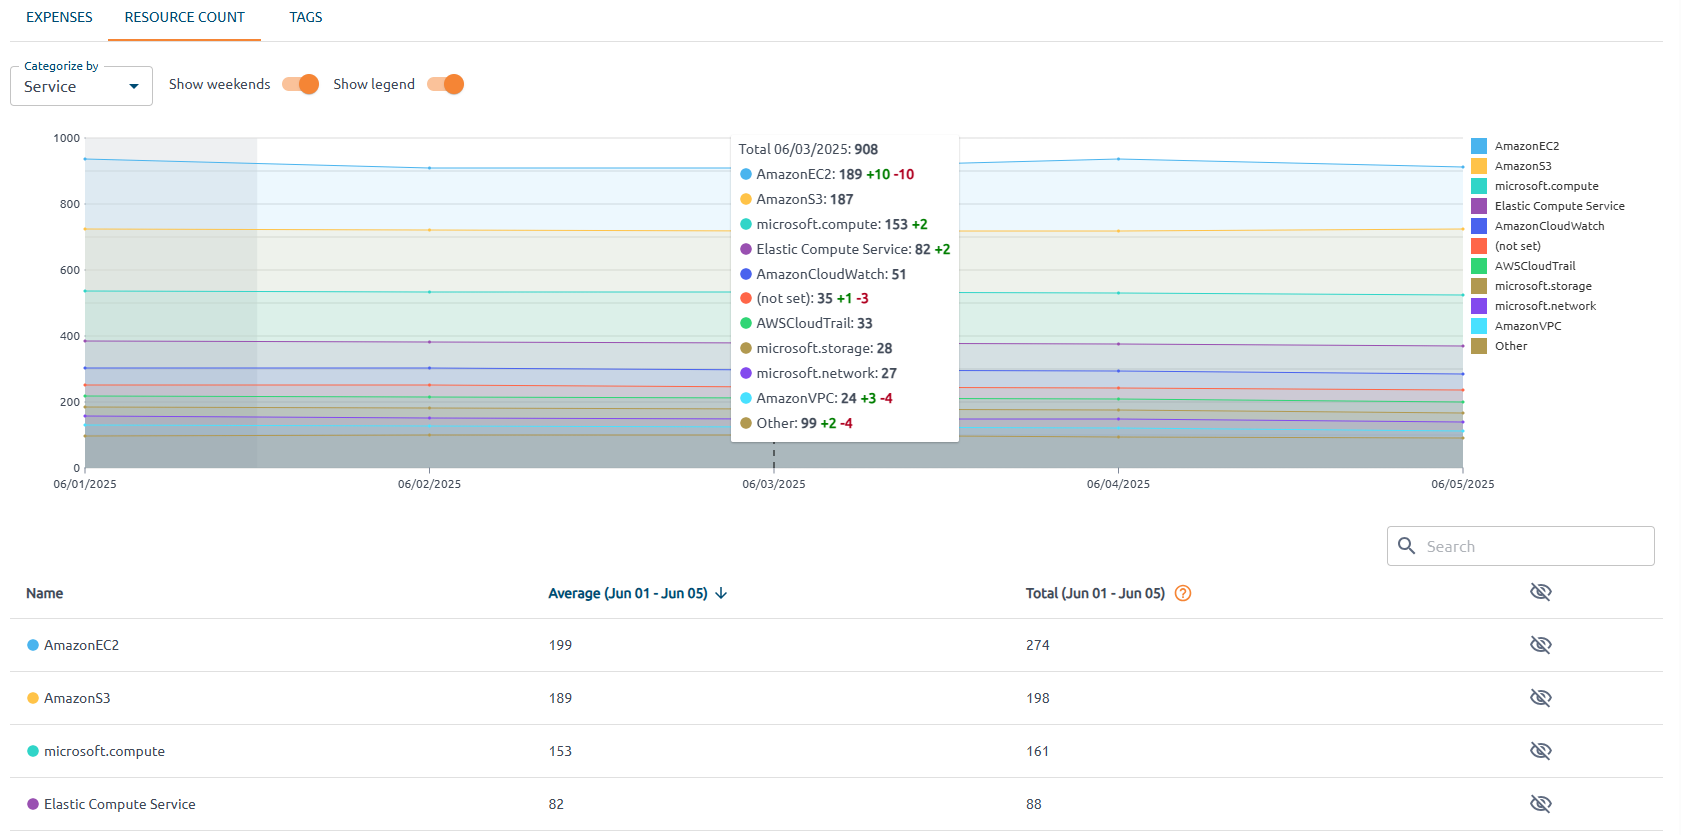
The table shows the average number of resources per day and the total number of resources for a specific item across the selected date range. An eye icon allows toggling visibility of each resource type line on the chart.
Tags#
The Tags tab provides insights into resource usage and costs categorized by tag keys. Use it to analyze how different tags—or the absence of tags—affect your cloud infrastructure.
The line chart displays the daily resource count for all resources over the selected time range. The tooltip displays total (black), daily creation (green), and deletion (red) values.
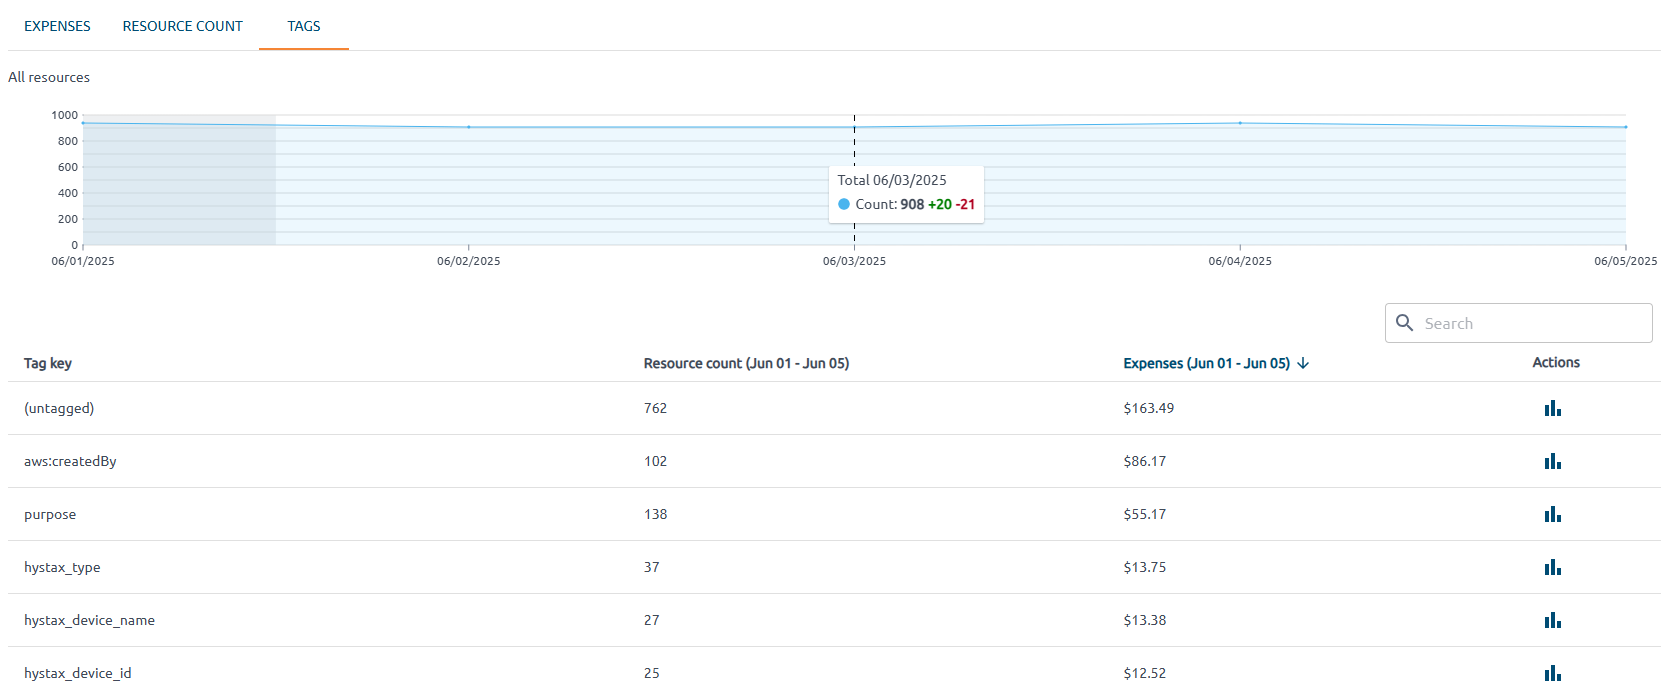
The table shows the number of resources tagged with each tag key and the corresponding expenses for the selected period.
Select on the icon in the Actions column of a specific tag from the table to update the chart and display only resources associated with that tag.