Different companies of various profiles extract value from data. Even a network of small hair salons in a neighborhood can use Excel as their CRM system to keep track of their customers. Based on your data, have you compiled a list of customers who last visited the salon a while ago? It’s time to send them an SMS with a personal discount.
At what point is it worthwhile for a business to create a data processing platform?
From Excel to ML: levels of data analytics maturity
At the beginning of this text, we mentioned a small hair salon. It’s a good example to continue talking about what’s happening in data analytics. For the rest of the story, let’s say it’s the “The Barbershop” barbershop network.
Below is a maturity model for analytical systems based on Gartner’s classification. There are four levels. Only some companies progress linearly from start to finish. Some companies quickly jump to levels 3 and 4. The most important thing is to have the necessary resources – money, specialists, and business objectives. And some companies will remain on Excel spreadsheets and simple BI systems. That’s normal too.
Our “The Barbershop” will go through each stage to make understanding the differences in maturity levels easier.
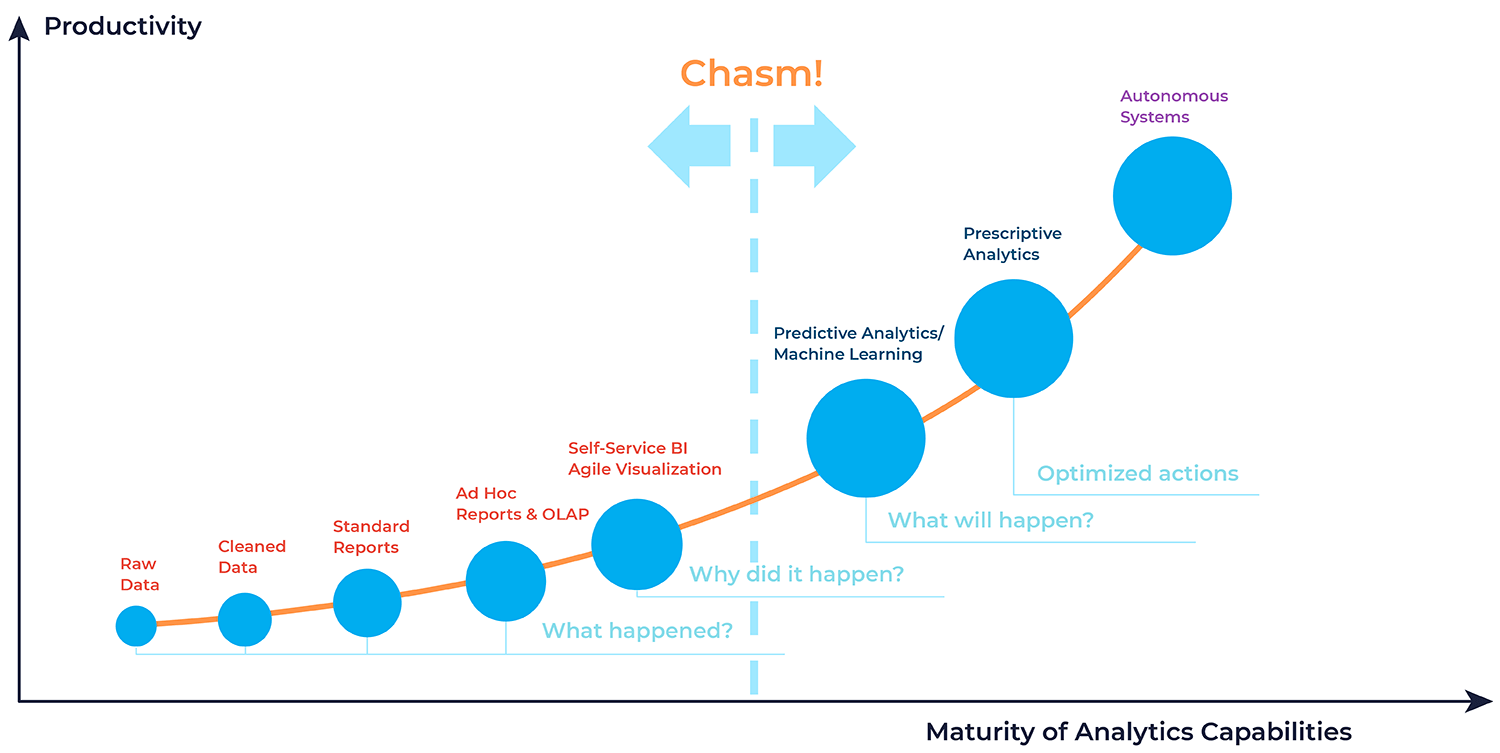
Level 1: Descriptive
We’ll combine the first three items into one block: raw and cleansed data and standard reports. This is the lowest level of data processing, which is most often done in Google Sheets or Excel.
So, our barbershop started collecting data on customers who come for haircuts and counting visits. The administrator enters the information manually, and some data is pulled from the registration form on the website. The manager can clean up the data from duplicates, correct errors made during registration, and structure the data by the number and variety of services provided monthly.
Based on this, you can create simple reports. Find out if the number of customers is increasing from month to month, which brought in more revenue over the summer – beard and haircuts.
This data answers the question: what happened? Hypotheses can be formulated, and decisions can be made based on them. Mostly, this is done manually and with the manager’s cognitive efforts.
This level also includes such analytics formats as Ad hoc reports and OLAP. Ad hoc reports are reports made for a specific business request. Usually, this is something non-standard that is outside of regular reporting. For example, the “The Barbershop” manager determines how many sales were made over three months for a cohort of bald but bearded visitors (broken down by day).
Level 2: Diagnostic
There is the so-called self-service analytics (self-service BI) at this level. This implies that specialists of various profiles, not just data analysts, can query the necessary data and generate summary reports. This approach also uses BI systems like Power BI, Qlik, or Tableau. Data specialists typically set up the dashboards in these systems.
Here, the data answers the question: why did this happen? They describe the company’s current state and serve as a source of analytical conclusions. For example, the “The Barbershop” revenue has doubled compared to the previous month. The data shows this happened due to several advertising posts about the barbershop’s promotion.
At this level, a company can move from Excel spreadsheets to Python scripts and SQL queries. Also, at this point, it’s necessary to have one or two data analysts on the team.
Why even transition to more complex tools?
The reasons may vary for each specific company:
- Increased workload with data. The company has started counting monthly profits and expenses, collecting data on marketing activities, recording customer churn, and so on. Multiplying dozens of new Excel spreadsheets becomes irrational – it’s easy to get lost in them and difficult to correlate events.
- The need for automation. Employees spend a lot of time manually collecting data. They could devote this time to work more useful for business growth.
- Improve data quality. The less automation of processes, the more room for human errors. Some data may stop being collected or be entered with errors. Automation and BI systems will help better “clean” data and find new directions for analytics.
- The number of analysts has increased. For example, the company has started developing in several regions. Each region has its analyst, but they must consolidate the data in one place. A single BI system and a common repository (or at least a database) can unify tools and approaches.

Level 3: Predictive and prescriptive
At this level, more complex concepts come into play. This stage involves predictive and prescriptive analytics.
In the first case, the data answers what will happen next. For example, it is possible to forecast revenue growth or customer base expansion in six months. Here, the analysis algorithm can be the basis of an ML model.
Prescriptive analytics are built on the question of what to optimize. The data shows that to increase the barbershop’s revenue by 60%, the advertising budget needs to be increased by 15%.
At this stage, we are not talking about just a few analysts but an entire team that can work on multiple business directions. Typically, at this point, companies need data processing platforms.
Level 4
The most advanced level is autonomous analytics systems based on artificial intelligence. Here, the machine proposes a presumably correct solution based on big data analysis, and the human makes the final decision.
Banks can use such systems. For example, these could be credit scoring systems for issuing loans. Our barbershop can use Lead scoring – a technology for evaluating the customer database from their readiness to purchase the company’s products.
Are the third and fourth levels only for big data?
The short answer is no.
The volume of data is not as important as the tasks facing the company
Of course, the more data, the more representative the results. However, operating with arguments like “I only have a database of a million people, all this platform processing is not for me” is also incorrect.
There may be a small amount of data, but it can be very diverse: records of conversations with clients, surveillance camera footage, user images, etc. All this must be systematically stored to extract valuable, business-applicable knowledge for the company.
The volume of data is not as important as the amount of analytics and analytical teams
If a company has several analytical teams for different business directions, this leads to problems. The teams may use a single data source but have different analytics tools and storage systems. Sometimes they may analyze the same thing or calculate the same indicator differently, which could be more rational. If a new analytical team is added, it risks duplicating part of the work already done.
The heterogeneity of analytical pipelines also leads to delays in meeting business requirements. A product manager may ask to fix a dashboard with product revenue, but the fix may only be delivered in 1.5 months.
Companies consider data processing platforms as the complexity of analytical tasks and the number of analysts grow. They provide a common foundation and accepted conventions: which tools we use to retrieve data from sources, where we store them, and how we organize storage.
✔️ While there are multiple ways to manage data processing, OptScale, the FIRST OPEN SOURCE MLOps platform, helps ML and Data engineers optimize the performance and costs of their experiments or production tasks.
The solution is fully available under Apache 2.0 on GitHub → https://github.com/hystax/optscale.
👆🏻 Developing and training ML models can be a complex and time-consuming process, and debugging and profiling these models is often a challenge.
Explore some tips and best practices to overcome the main challenges → https://hystax.com/how-to-debug-and-profile-ml-model-training